A watershed is a system in motion. Rain arrives, water moves through the ground, and streams carry it onward. Instruments can record that movement for years; this project gives the record a sound.
Working with Professor Mark Ballora and the Penn State Critical Zone Observatory, I developed a sonification of three years of hydrologic data from the Susquehanna Shale Hills Critical Zone Observatory. Groundwater, stream water, and precipitation become three related voices. Their behavior is driven by measurements of the water itself.
Follow the water's fingerprint.
The project uses the relative amounts of oxygen isotopes in water as a way to follow changes in the watershed. Oxygen-16 and oxygen-18 occur in different proportions, and those proportions carry information about water's origins and passage through the hydrologic cycle.
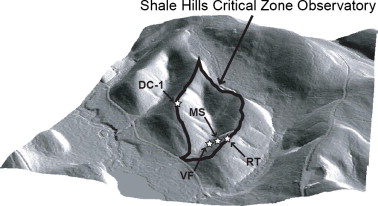
At Shale Hills in central Pennsylvania, monitoring instruments collect the observations that make this kind of investigation possible. The observatory belongs to a wider critical-zone research effort concerned with the interactions between bedrock, soil, water, vegetation, and atmosphere.
For the sonification, the key material was a set of measurements extending across three years. That duration creates two scales of interest: the passage of individual weather events and the larger patterns that become visible across seasons. Sound makes it possible to move through the record at either scale.
Let the instruments suggest the system.
I built the voices in SuperCollider, using synthesized water and weather sounds as the basis for the mapping. The measurements control how those sounds behave. A familiar sonic character gives the listener a way into the data before the finer variations begin to matter.
Groundwater becomes droplets. The isotope data shapes their rate, variation, pitch, loudness, and stereo position. The instrument can change in several ways at once, letting a movement in the data register as a change in the whole sound.
Stream water becomes a moving current. A variation on a babbling-brook synthesis carries the stream measurements through changes in pitch, airiness, amplitude, and position. Its texture gives this voice a different continuity from the discrete events of the groundwater instrument.
Precipitation becomes rain and thunder. The data affects graininess, duration, amplitude, perceived distance, and stereo position. An adjustable threshold governs when the thunder is triggered. The weather voice can therefore mark a change through both a sustained texture and a distinct event.
More than one way to hear a change.
A single measurement can influence several properties of an instrument. That was an important part of the design. Pitch, rhythm, loudness, and spatial movement provide different cues, giving a variable a richer audible presence as it changes.
The implementation normalizes the measurements into usable synthesis ranges, then steps through the data to generate sound. Playback speed becomes an analytical control. A faster pass compresses the record and brings longer patterns together; a slower pass gives an individual event room to develop.
The instruments keep the same relationships to the source while the listener changes scale. That makes comparison part of the composition: between years, between events, and between the three voices sounding together.
Inside the groundwater instrument.
This SuperCollider definition shows the synthesis at work. Impulses, filtered noise, delay, and reverberation build the water-like texture; its exposed parameters give the data multiple points of control.
(
SynthDef(\groundwater, {| gate=1, amp=40, pan=0, mul=0.005, rq=0.03, pitch1=500, pitch2=800, lpf1=14, lpf2=30, noise1=1, noise2=1, bubble1=1, bubble2=1, delay=0.002|
    var src, src2, out, env;
    env=EnvGen.kr(Env.asr(0.01, 1), gate, doneAction:2);
    src=OneZero.ar(Impulse.ar(noise1), 0.99);
    src=RHPF.ar(src, LPF.ar(BrownNoise.ar(bubble1), lpf1)*600 + pitch1, rq, mul);
    src2=OneZero.ar(Impulse.ar(noise2), 0.99);
    src2=DelayL.ar(RHPF.ar(src2, LPF.ar(BrownNoise.ar(bubble2), lpf2)*600 + pitch2, rq, mul), 0.2, delay);
    out=Mix.ar([src, src2]);
    out=GVerb.ar(out, 20, 3, drylevel:0.01);
    out=Pan2.ar(src+src2, pan);
    Out.ar(0, out*env*amp*~masteramp)
}).add;
)
Listen across the years.
The project explores how a large environmental record can become something a researcher listens through. Seasonal changes, outliers, and recurring fluctuations take on an audible form, while the separate instruments keep groundwater, stream water, and precipitation recognizable within the same scene.
What interests me is the combination of familiarity and abstraction. The sound suggests a place, but its activity comes from measurements. A dataset collected across years becomes an environment that changes around the listener.
References
- Brantley, S.L., White, T.S., Anderson, S.P., Bales, R.C., Chorover, J., McDowell, W.H. (2013): Critical Zone Science and Observatories. Abstract TH15D-01 presented at 2013 Fall Meeting, AGU, San Francisco, CA, 9–13 Dec.
- Whitenack, T., Williams, M.W., Tarboton, D.G., Zaslavsky, I., et al. (2010): Development of an integrated information system for Critical Zone Observatory data. Fall Meeting, American Geophysical Union, December 2010. Abstract IN31B-1289.
- McGuire, K. and McDonnell, J. (2008): Stable Isotope Tracers in Watershed Hydrology, in Stable Isotopes in Ecology and Environmental Science, Second Edition.
- Wilson, Scott, Nick Collins, and David Cottle. The SuperCollider Book. Cambridge, MA: MIT Press, 2011.